How circular is the Flemish economy?
To assess whether we are on the right track, we need data. That is why we publish the Circular Economy Monitor. In this analysis, we give the main findings based on this data in a nutshell.
The Flemish Government wants to make Flanders a circular leader in Europe. She wants to do this by investing in circular innovation, decoupling the material footprint of our consumption from economic growth and reducing it by 30% by 2030.
With a circular economy we become less dependent on the import of expensive raw materials, we limit the environmental impact of our economy and we create opportunities for (social) innovation.
There is also a strong link with the climate: two-thirds of our territorial greenhouse gas emissions are directly related to the extraction, processing, consumption, recycling and disposal of materials (for all needs: food, energy, construction, etc.).
But to know whether we are on the right track, we need data. We need to measure in order to guide policy. In 2021, Circular Flanders and the CE Center launched the Circular Economy Monitor. Below we provide a summary of the most important findings based on the most recent figures.
The Flemish Government wants to make Flanders a circular leader in Europe.
1. Consumption of materials within Flanders is decreasing slightly and we produce less waste
Domestic material consumption (DMC, Domestic Material Consumption) amounts to 164 million tons and shows a slight decrease in the longer term. If we also include the consumption of materials outside Flanders for our consumption, we call it Raw Material Consumption (RMC). That is the actual footprint of our consumption: the figure in 2021 is 196 million tons, which is 29.5 tons per inhabitant. That figure is slightly lower than in 2010. After an increase, a decline has been noticeable in recent years: we see the corona crisis partly affecting the figures. This decline still needs to be further confirmed. Flanders has the ambition to achieve a decrease of 30% by 2030 compared to 2010.

We see a sharp decrease in total household waste in Flanders, from 522 kg per inhabitant in 2013 to 416 kg per inhabitant in 2022. Within this number, residual waste amounts to 128 kg per inhabitant in 2022, overperforming the target for that year of 138 kg. The Flemish government wants to further reduce this quantity to 100 kg per inhabitant by 2030. Waste production is relatively high in companies due to the large production for export. Their waste production moves with the evolution of the economy and we see that industrial residual waste has decreased by 5% in 2021 compared to 2013 after correction for employment.
2. Flanders is strong in recycling, we are taking steps towards higher-quality circular strategies
In recent decades, Flanders has focused heavily on selective waste collection and the development of a recycling industry. The recycling rate (excl. construction and demolition waste) is 65.6% in 2022 and has increased by a few percent in recent years. 67% of industrial waste is given a second life. That becomes 78% if we add the recycling and reuse of construction and demolition waste. These figures have increased over the past ten years. The production of secondary raw materials, with a volume of 25.8 million tons in 2020, also shows such an increase.
Expressed as a comprehensive figure, the circular use of materials in Flanders amounts to 16%. This figure shows how many tonnes of material in our total processed materials are of secondary origin. 16% is certainly a good result, but this does not summarize the circularity of the Flemish economy. We currently do not have enough figures to visualize the quality of recycling.

At the same time, the circular economy is much more than recycling. The total reuse of products such as white goods, electrical equipment, household goods, textiles, furniture, etc. by households – not recycling them (converting them into raw materials) but reusing them in their entirety through formal and informal channels – has increased to 35.5 kg per inhabitant in 2022, or 238,000 tons. The total size of repair in Flanders is around 10 million repair actions in 2023.
3. The total consumption of materials grows alongside our economy
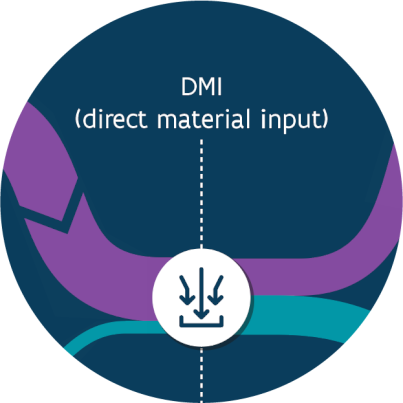
The Flemish economy is an extensive system that directly consumes 341 million tons of materials annually. This Direct Material Input includes everything that passes 'through the hands' of Flemish companies and increases over the years. We also include production for export. 85% (292 million tons) of those 341 million tons of materials are imported. About a third of the DMI consists of fossil raw materials for energy production or further industrial processing. If we also look at the raw materials consumed abroad to run our entire economy, we see that the figure, the Raw Material Input, increased from 500 to 562 million tons between 2012 and 2021.
We can also express the ratio between the size of the economy and the total consumption of materials as material productivity, as a measure of the efficiency with which the entire Flemish economy creates added value from materials. This efficiency of our entire economy has remained constant over recent years. Increasing it, as previously achieved for labor and energy productivity, is a central challenge for the circular economy. At the same time, we see that a number of circular sectors have shown a growth in employment over the years that is steeper than the growth of Flemish employment. The turnover of reuse centers shows spectacular growth.
Extensive use of materials inevitably leads to great environmental pressure. We are not only putting great pressure on the world's finite resources of raw materials. There is also a strong link between materials use and climate change. After all, two-thirds of domestic CO2 emissions are caused by the extraction, processing, consumption, recycling and disposal of materials (for all needs: food, energy, construction, etc.). The greenhouse gas emissions of the Flemish economy have decreased, but are at a high level of 73 million tons per year. This is purely domestic emissions: the emissions caused by our consumption abroad are not included. This is included in the carbon footprint.
4. In detail: circular mobility, housing, consumer goods and food
The Circular Economy Monitor also zooms in on some so-called 'need systems': mobility, housing & buildings, consumer goods and food. By looking at need systems, and not, for example, at sectors (construction, automotive industry, etc.), we can look at the indicators with a broader view. Our (circular) economy must meet these needs in any case, that is certain. The way in which we fulfill those needs can vary greatly. For example, a mobility need can be met with, say, wider roads, more cars, longer buses, more trains, more shared cars, and so on. So we will not just look at the production of cars or houses, but at the most complete picture possible at the level of needs. We share the most important findings.
Mobility: fleet stabilizes, car sharing continues to grow, impact of electrification on materials
Though the dominance of cars is still there, we have recently noticed that the car fleet has stopped increasing in relative terms. The popularity of car sharing continues its growth. The impact of electrification is visible in the figures: 1% of the number of kilometers is traveled with electric bicycles and the mass of new vehicles has been increasing abruptly by tens of kilos per year from 2020 on. This illustrates the rapidly changing challenges of this transition in the field of materials management.

Housing & buildings: ever-increasing use of space, more data on circular construction and demolition are needed
The built-up area continues to increase. A lot of renovation is being done, which is necessary to maintain our building stock and for the sake of the climate objectives. There are currently few figures to express the degree of circularity in construction and renovation. The recycling rate for construction and demolition waste is very high at 96%, but we do not have figures to further illustrate the quality of this recycling.
Food: high impact of consumption and production on the environment and resources, efficient system, attention to protein shift and food loss.
Food has its own challenges in terms of circularity. The flows are inherently circular: food essentially moves from field to fork to field. You can also only apply 'higher' circular strategies such as reuse and recovery to a limited extent: food spoils and can only be used once. There can still be more circularity in the form of (1) less pressure on resources in primary production, (2) combating overconsumption and food losses, (3) using residual flows in increasingly high quality. Our behavior can help making a difference: there is still some way to go in terms of protein shift and a lot of food and food waste still disappears through residual waste.

Consumer goods: half of electrical appliances are selectively collected, second-hand is an important circular channel and 'repair' has been mapped out
Flemish households owned 224 million electrical appliances in 2022. Half of it is collected selectively. The official reuse centers collected 85,000 tons of goods in 2022 and put 40,000 tons back into circulation: that is 6 kg of reuse per inhabitant. The target of 7 kg per inhabitant for that year was not achieved; for 2030 the target is 8 kg per inhabitant. The total reuse of consumer goods (white goods, electrical equipment, household goods, textiles, furniture, etc.) through formal and informal channels amounts to 35.5 kg per inhabitant in 2022, or 238,000 tons. Every year, 50 kilotons of textiles are selectively collected for reuse or recycling; 4.5 kilotons of it are put back into circulation via the reuse centers. In 2023, the repair of utensils was mapped out more broadly for the first time: approximately 10 million repairs were carried out, mainly to bicycles, textiles and electrical appliances.

5. Vlaanderen pakt de uitdaging aan
The figures reveal nice achievements in terms of reducing the outflow of materials and closing cycles through recycling, as a result of a strong commitment in recent decades to selective waste collection and the development of a recycling industry. A reduction in the influx of materials has not yet been demonstrably achieved: here lies the challenge for Flanders to make higher-quality circular strategies such as reuse and repair mainstream: less use of materials, lifespan extension through maintenance and repair, as-a-service models, ecodesign, reuse , remanufacturing, innovative and high-quality use of (biomass) residual flows... We must take these steps for both industrial-strategic reasons and for ecological reasons. Further development of our data should allow us to gain insight into these types of underlying shifts and their economic effects - which are now often hidden in the general figures. The monitor is able to make opportunities and pitfalls visible at different levels. We have recently been able to better map the higher R strategies for reuse and repair. By integrating existing or yet to be developed targets, the monitor enables to continue impacting the circular economy transition. At the same time, the monitor points out a number of data and knowledge gaps. For example, we would like to better monitor electrification in mobility or be able to display the quality of recycled materials. In addition, we also want to be able to take steps to develop scenarios based on strategic objectives such as reducing the materials footprint.


