

What do we see?
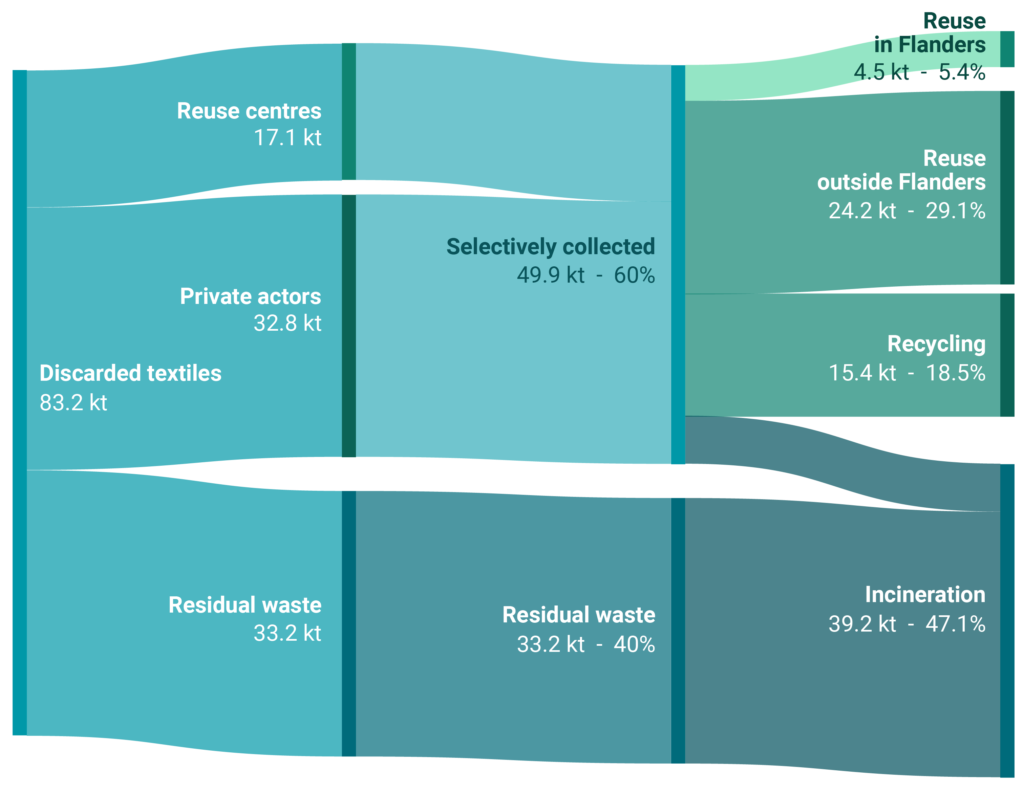
In Flanders, consumers can dispose of their textiles through three channels: residual waste, selective collection of textiles, or via direct drop-off at a reuse centres. The 33 kilotonnes still discarded via residual waste in 2022 will be incinerated with energy recovery. The remaining 50 kilotonnes of textiles selectively collected in Flanders can be prepared for reuse or recycling. We see that this flow has continued to fluctuate around that value over the last decade.
Exact figures of what else happens to the collected textiles are not available at the moment. What we do know is the amount the reuse centres put back into circulation locally. This flow comes from both direct delivery to recycling centres and selective collection of consumer textiles in the municipalities by recycling centres, e.g. via textile containers. Furthermore, only the orders of magnitude for global re-use, recycling and incineration are known. For recycling, in 2022 all materials will still go to ‘open-loop recycling’, meaning that the materials will be used in another value chain. For textiles, this is either fibreisation into non-woven fabrics (e.g. insulation material), or use as cleaning cloths.
What’s the aim?
The European Commission’s Waste Framework Directive (WFD) has established a hierarchy to guide waste treatment. In this hierarchy, reuse and waste prevention are at the top and recycling is considered the next best option. In a circular economy, we need to use, reuse and recycle materials as much as possible to avoid destroying valuable materials and to preserve their value for as long as possible. Only when materials can no longer be recycled should they be incinerated with energy recovery. Landfill is the very last option.
Separate collection of waste and materials is a crucial step to increase reuse and recycling. Here, local reuse is preferred. The disadvantage of reuse on the global market is that we lose control over the end-of-life phase, so the textiles could still end up being landfilled. However, collected textiles are not always suitable for reuse. Much depends on quality and market demand. Lower-quality products are examined to see whether they can be recycled. Here, high-quality recycling, also known as closed-loop recycling, is preferred. Only if reuse and recycling are not an option, for example in the case of contaminated textiles, do they go to incineration.
What does this indicator measure?
This indicator reflects the reuse of textiles in Flanders through the recognised reuse centres, the official reuse network in Flanders. The figures are expressed in kilotonnes; reuse is also plotted against the number of inhabitants. The data for this indicator were provided by OVAM. These figures underestimate real reuse because people turn to informal channels in addition to reuse centres. However, these channels are included in the calculation of total reuse in Flanders. The Sankey diagram comes from an ongoing research project at KU Leuven in collaboration with UUtrecht.


